
If you create a test script using the recorder or even if you use your favorite editor the scala test code will need to be stored in the simulations directory (ie %gatling_home%\user-files\simulations). The gatling.bat script (ie %gatling_home%\bin) will look in this directory to compile all classes so you can run your test. If the gatling.bat script is run without any parameters then Gatling will display a list of tests that have been compiled and are available to be run.
 Example
 Choose a simulation number:
      [0] RecordedSimulation
      [1] gapiv5
      [2] bigfootv13
      [3] gpv10
This is a list of the available “classes”, one for each test. Just like with Java each class name of each object must be unique. The class in the recorded example is called “RecordedSimulation”. This actually matches the name of the file that we saw in the recorder dialog. Simply press the number 0 (in this case) to run our recorded simulation.
Gatling test scripts are actually small command line programs that once compiled are run with all of the output going to the terminal screen. Below is the output from running our recorded simulation.
 Choose a simulation number:
      [0] RecordedSimulation
      [1] gapiv5
      [2] bigfootv13
      [3] gpv10
 0
 Select run description (optional)
 my first script
 Simulation RecordedSimulation started...


 =================================================================
 2019-11-07 14:30:27                            5s elapsed
 ---- Requests ---------------------------------------------------
 > Global                                    (OK=1      KO=0     )
 > search asrock                             (OK=1      KO=0     )


 ---- RecordedSimulation -----------------------------------------
 [---------------------------------------------------------------]  0%
           waiting: 0      / active: 1      / done: 0
 ==================================================================

==================================================================
 2019-11-07 14:30:33                           11s elapsed
 ---- Requests ---------------------------------------------------
 > Global                                    (OK=5      KO=0     )
 > search asrock                             (OK=1      KO=0     )
 > search mac                                (OK=1      KO=0     )
 > fetch computer                            (OK=1      KO=0     )
 > update computer                           (OK=1      KO=0     )
 > update computer Redirect 1                (OK=1      KO=0     )


 ---- RecordedSimulation -----------------------------------------
 [###########################################################]100%
           waiting: 0      / active: 0      / done: 1
 ==================================================================


 Simulation RecordedSimulation completed in 11 seconds
 Parsing log file(s)...
 Parsing log file(s) done
 Generating reports...


 ==================================================================
 ---- Global Information -----------------------------------------
 > request count                           5 (OK=5      KO=0     )
 > min response time                     176 (OK=176    KO=-     )
 > max response time                    3069 (OK=3069   KO=-     )
 > mean response time                    815 (OK=815    KO=-     )
 > std deviation                        1130 (OK=1130   KO=-     )
 > response time 50th percentile         240 (OK=240    KO=-     )
 > response time 75th percentile         400 (OK=400    KO=-     )
 > response time 95th percentile        2535 (OK=2535   KO=-     )
 > response time 99th percentile        2962 (OK=2962   KO=-     )
 > mean requests/sec                   0.417 (OK=0.417  KO=-     )
 ---- Response Time Distribution ---------------------------------
 > t < 800 ms                              4 ( 80%)
 > 800 ms < t < 1200 ms                    0 (  0%)
 > t > 1200 ms                             1 ( 20%)
 > failed                                  0 (  0%)
 ==================================================================

 Reports generated in 1s.
 Please open the following file: C:\Users\chris\gatling-charts-highcharts-bundle-3.3.0\results\recordedsimulation-20191107133020038\index.html
This output actually does tell us some information about our test. Because some meaningful comments were inserted into our test script.
.exec(http(“search mac”)
We can see those meaningful names as the script progresses. At the end of the output we can see that there was four calls that were processed in less than 800 milliseconds while a fifth call took longer than 1200 milliseconds. We can also see that there were no failures.
Despite the fact that this output does indeed tell us about how the run went it is actually much easier to look at the html page that we created to see a graphical representation of our script. The last line of the run output gives us the path to the index.html file which has been generated. If we view that html file with our web browser we will see something similar to the following.
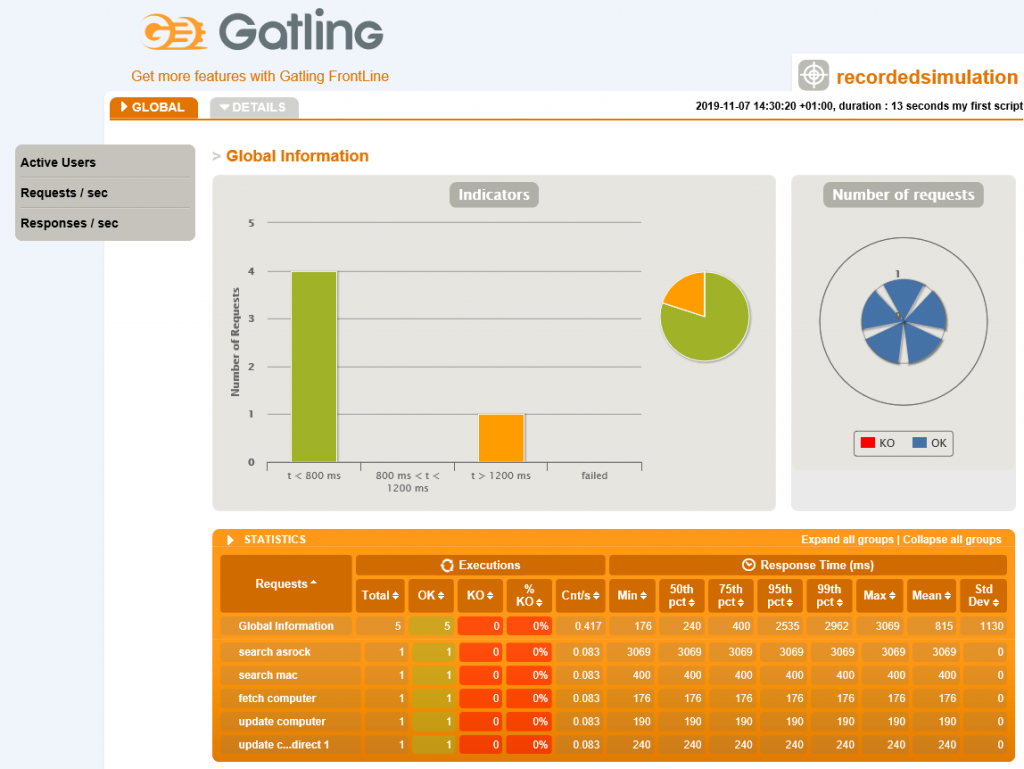
This image is just part of the web page that is created but it does contain all of the statistics. We can see which of our calls succeeded and how long it took (min, max and average). In this case all of our numbers are the same but if we did run this script multiple times we would be able to see how many were in the 50, 75th and 95th percentiles.
Each one of our steps only perform one task so there is little reason to look much deeper but if each of these performed more than one call or loaded some important resources we could get a better look at the times by examining the details of each one of these steps.
If we look in the upper right hand corner of the picture we can see the name of the class, the runtime and the description that we gave when running it (ie my first run script)
Our script was generated by the recorder as pure Scala code. In my next blog I will clarify a bit of the Scala syntax.